With today’s technological capabilities, we have access to numerous sources of qualitative and quantitative data. However, an exhaustive amount of raw data fails to reveal patterns that describe churn rates. Moving from raw data to predictable data requires a data mining process that considers data definition, cleansing, aggregation, and transformation. This process untangles the data to show concrete characteristics that affect agent retention at call centers so that you start seeing actionable results.
From Raw Data to Predictable Data
Data Defining and Data Discovery
The process of creating predictable data begins by engaging with the customer who provides raw data from various sources. We refer to this as Data Discovery. For a call center, these sources might look like information on agent hire dates and last date of employment. Another source might include data about base salary, if an agent received a bonus, and when their last raise occurred. Yet another source could cover days absent and the number of rescheduling requests. Once AnswerOn receives the raw data, we work to understand the specifics of the data. Data dictionaries help, but we also need to understand the business rules behind the data.
Additionally, we need to know the specific problem a company wants to solve. While one customer might want to lower churn rates at all their site locations. Another might want to improve churn rates at only several under-performing sites. Different goals require different models. For this reason, AnswerOn prefers raw data as opposed to data that is summarized to understand the nuanced differences across sources and view the most granular information. These details help customize a customer’s model in order to achieve the best possible accuracy.
Data Cleansing
After gaining an understanding of the specifics of the data (Data Discovery), we move the raw data that has been copied from our secure FTP site to our internal Data Warehouse. AnswerOn loads all the different sources of customer data. We then merge the sources using a shared trait, like a customer or employee ID number. In some cases when a shared trait is not available, AnswerOn will generate a key that allows the various data sources to be combined correctly. Then we can align the data so that time periods are accurately represented. The alignment stage places uniform ranges across everything for each variable. At this point, we address missing values and null data fields. Also, while in the cleansing stage, we set data parameters to remove outliers that might affect future predictive results.
Data Aggregation
At this point, with the knowledge that we have gained in the Data Discovery and Data Cleansing processes, we can begin the data modeling process. Future raw data will funnel into our systems every month, keeping a complete history of all unprocessed data. During this process, the number of values could increase due to added variables (features). Yet, not all the given raw data values always make it into the predictive model. Some raw data points may be irrelevant or lead the model astray with false conclusions. This is determined by various statics generated from the data.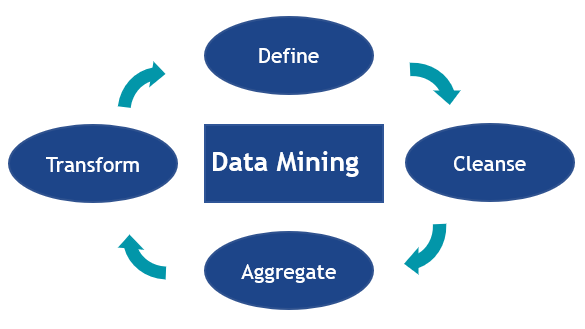
Data Transformation
The final component is the transformation of the data where we take the raw data and generate new variables (features). This process has a two-fold benefit. It improves the accuracy of the model and generates more information that AnswerOn’s data analysts can use to help the customer understand the specific causes of churn.
Then we codify the ETL process. We process raw data contained in the Data Warehouse using the information from data discovery and rules definition transforming it to sophisticated data, returning it to the Data Warehouse to send on to the modeling engine. The output from the modeling engine represents a set of predictable scores that the customer can use to address their churn problem. Customers then have access to these scores and associated interventions for each individual agent using the AnswerOn portal, through either a desktop version or mobile app. Using graphical application, our data analysts generate visual and quantitative reports that are also available via the AnswerOn portal.
The data mining process automatically repeats periodically as specified by the customer, a technique known as a “feedback loop.” Repetition ensures the model continues to refine itself, becoming increasingly predictive over time. Each of the four stages plays a role in creating accurate, predictive and actionable models. Moving from raw data to predictive data allows managers and leaders to understand the root causes of their agent attrition so they can intervene and solve their churn. Although you can build models from raw data, not understanding what your data represents results in decreased accuracy. Because of AnswerOn’s nearly two decades of experience in data mining, we provide a high value to our customers with our unique knowledge of best practices of predictive modeling to generate the most accurate results.