Written by: Michael Mozer, Scientific Advisor at AnswerOn and Professor at the University of Colorado
Let’s start with an obvious point. If you want to make good predictions, you need to have the relevant information. For example, suppose a friend who is shopping for a used car calls and says, “I found a car that is red and was just washed and has comfortable seats. Do you think it will be reliable transportation?” Obviously, your friend has not given you the information you need to evaluate the car’s dependability. You need information like the age and model of the car, whether it has been in accidents, etc. Additional information may be useful but more difficult to obtain or interpret, e.g., fault codes from the car’s computer and who owned the car previously.
When building predictive models, the information provided to the model and the manner in which it is encoded or formatted is known as the input representation. Much of the art in modeling comes from selecting a representation that is well suited to the domain. The choice of representation can determine what can be learned and how readily it will be learned. To illustrate with a simple example, consider one important factor in predicting auto reliability: the age of the car. One might expect the age to be a really useful variable, as older cars tend to have more problems. That is, the expected frequency of car problems will grow monotonically with the car’s age, something like this:
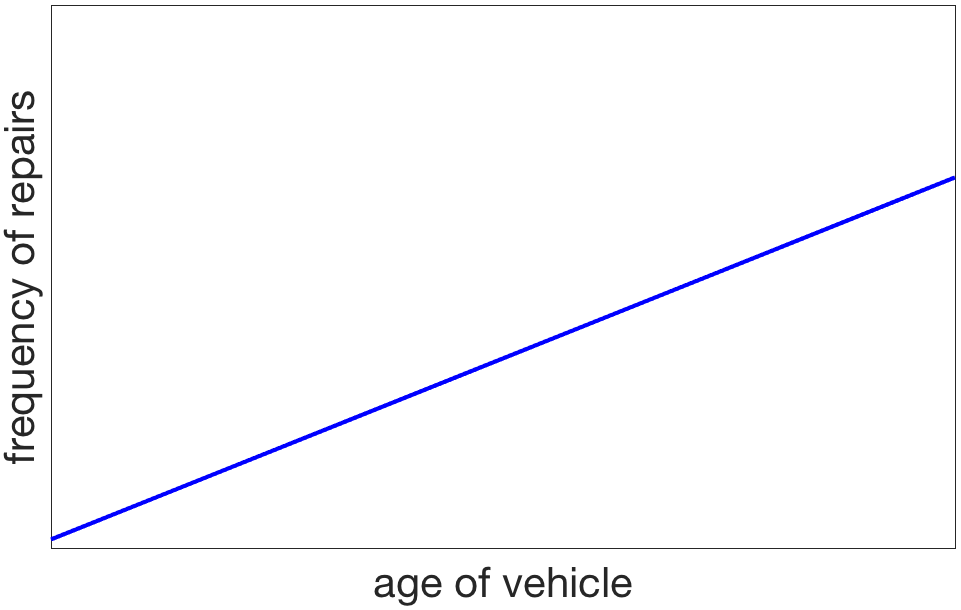
This simple, direct, linear relationship between the variables indicates that age is a good predictor on average. However, an individual who purchases a new car may experience a very different pattern: when the car is under warranty, it works flawlessly; however, the month after the end of the warranty, a continuous stream of problems arise. The graph for my car, which had a three year warranty, looks something like the red line here:
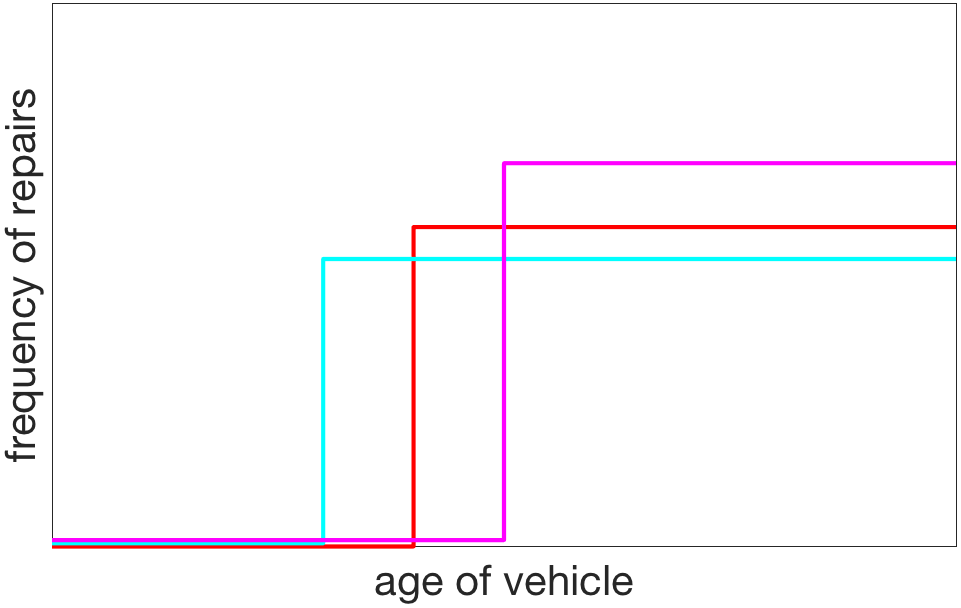
The magenta and cyan lines might reflect the experiences of individuals who have shorter or longer warranty periods. If auto manufacturers are indeed perverse and design their products to break after the end of the warranty period, then a model that predicts repair costs requires more information than the age of the car. Further, age is not as relevant or useful as the binary variable indicating whether the car is in or out of warranty.
This example is a bit extreme, but it makes the point that understanding the domain being modeled is important to determining an appropriate input representation. A more realistic example comes from AnswerOn’s experience predicting customer churn in the wireless industry. When examining the churn rate given the length of time with a provider, it became apparent that the graph had multiple surprising blips, sort of like this:
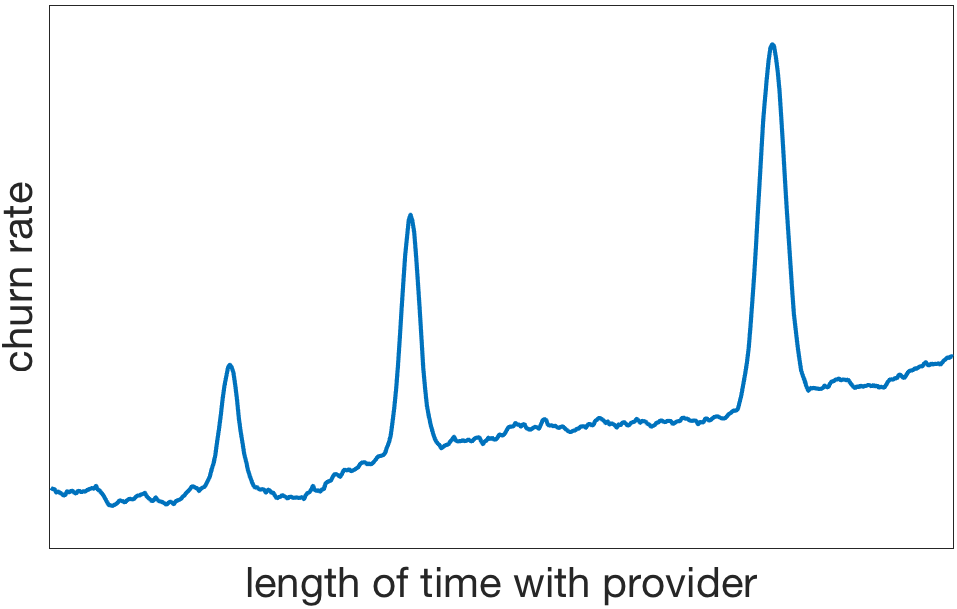
An obvious thought is that the blips represent the points in time at which contracts are up and the customer has the option of switching to another provider. The situation turned out to be a bit more interesting: The third and largest blip did represent the end of a two-year contract, but the other two blips appeared at 6 months and 1 year, while the customer was still under contract. What’s going on? AnswerOn’s conjecture was that individuals re-evaluate their lives according to the calendar year, such as when a student starts a new semester or a couple celebrate an anniversary. To the extent that these events are influencing an individual’s decisions, they ought to be represented to the model. That is, instead of constructing a model that uses merely the length of time an individual has been with a provider, the model might also be provided with input variables indicating whether individuals are near their 6 month or one year anniversary. In principle, these variables are not necessary because their effects are incorporated into the complex curve relating churn rate and time, but by including them, the model does not need to learn the complex curve; instead it can learn a simple linear relationship (churn increases with time) along with the blips at 6 months, 1 year, and the end of contract. Furthermore, it’s possibly that by making the blips into explicit components of the input representation, the model will be able to discover interactions between these components and others. For example, it may be that the first blip is larger for school-age customers.
This case study illustrates a further benefit of considering representation: it often leads to inclusion of other variables that might have been ignored. To the extent that certain times of the year trigger an individual to re-evaluate their choices, perhaps birthdays and the new year might be important events that trigger contract cancellation. The graph above–in which time is represented with respect to the start of a contract–will fail to capture such regularities.
We depend on statistical models to discover regularities in the data, but these regularities exist only if the right set of variables are available and are represented in a manner that is accessible to the model. Even with a powerful statistical model like deep learning, and even with a lot of data, intelligent design of the input representation can be a critical factor in the model’s success.